Problem context
Prior to the release of ChatGPT, deep learning generative models were not as popular, despite the existence of proven architectures like Generative Adversarial Networks (GANs) and Variational Autoencoders (VAEs). During my internship, I noticed a strong demand in the industry for better utilization of data, making it more easily understood by computers and thus providing greater convenience for users seeking that information. Graphs were commonly used as a way to represent data, and graph databases like Neo4j were available. However, converting text data into graphs usually required a large number of people to manually label and annotate the relationships between entities. This led me to consider the possibility of using generative deep learning models to directly capture the relationships among entities in a paragraph. In this project, I designed a novel architecture for graph generation, specifically focusing on the generation of adjacency matrices.
Implementation
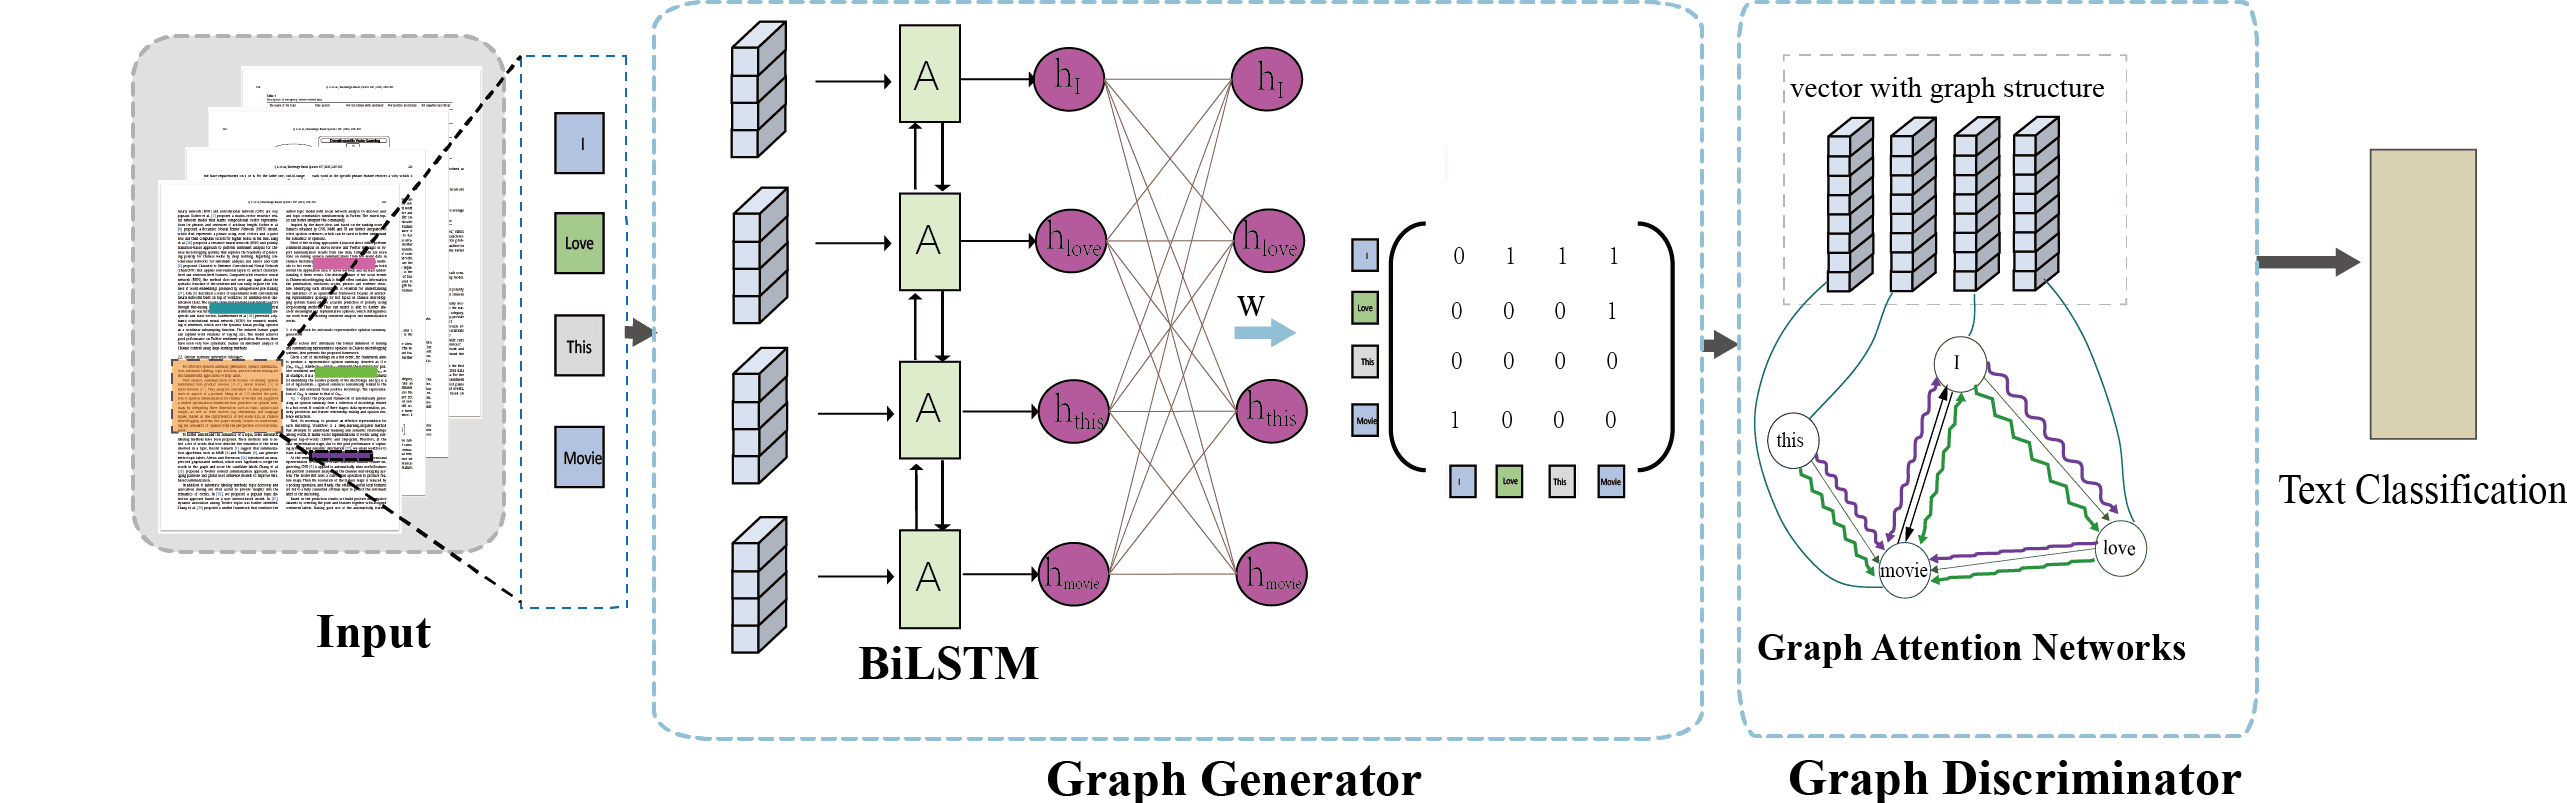
Typically, a target function guides the learning process of a generative model. For example, in Natural Language Processing (NLP), researchers often mask several words in a sentence and train the model to successfully predict those masked words. In our case, to generate semantically meaningful graphs, we introduced a traditional text classification task as the final objective function. This task was only required during the training process and was not part of the graph generation process itself. Interestingly, our model achieved competitive text classification results, even though that was not our primary goal. As shown in Figure 1, words were tokenized and digitized into numbers before being fed into bidirectional LSTM networks. Then, each resulting embedding was connected to all other words to capture the relationships among them, resulting in an adjacency matrix. With the adjacency matrix, we proceeded to the second step of implementing Graph Attention Networks on the generated graph and performed text classification.
Results
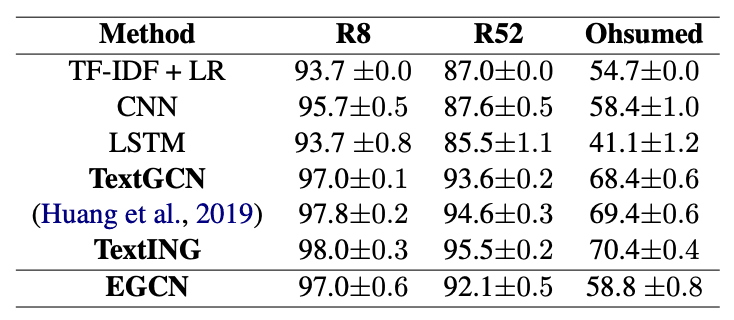
We began by analyzing our results to assess the quality of the classification. Although our results did not surpass those of other graph-based methods, they outperformed traditional approaches and came close to the performance of state-of-the-art classification models.
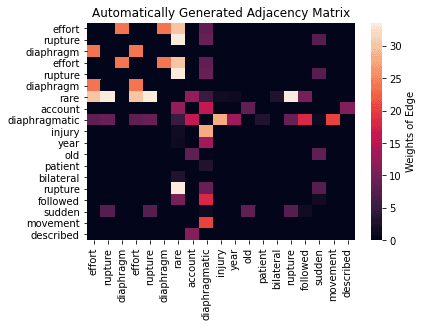
As previously mentioned, the classification objective was used to guide the generation of the graph. Now, let's evaluate the quality of the generated graph. Figure 3 displays the adjacency matrix, where words appearing in the same sentence are shown on the x and y axes. Interestingly, the matrix is symmetric, and the edge weights (representing relations between words) are visibly higher for certain edges compared to others.
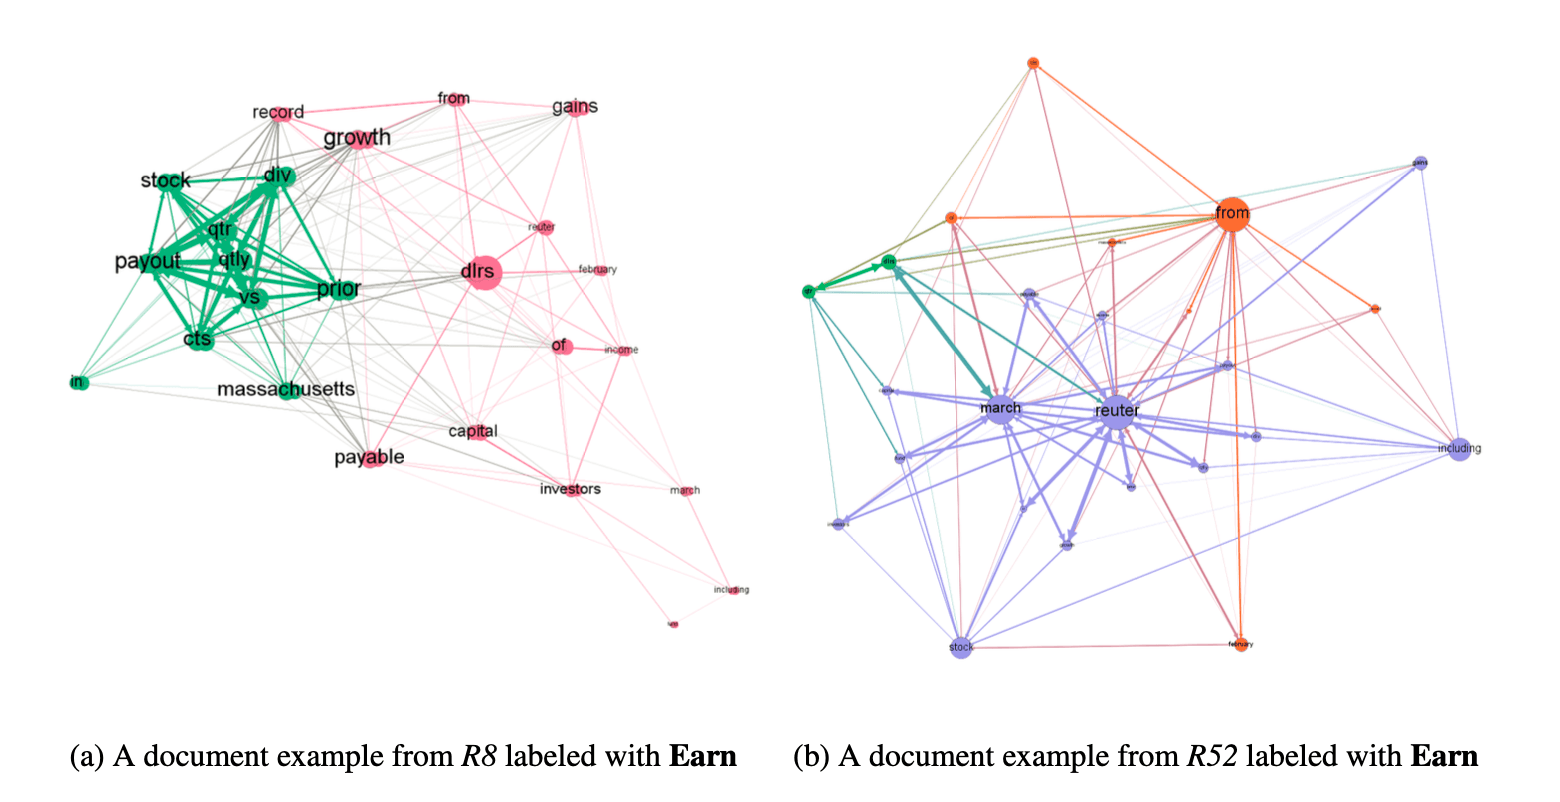
Finally, we directly visualize the generated graph in Figure 4 below. The graphs represent two texts that were classified as belonging to the "Earn" category. In the graph on the left-hand side, certain words like "payout" and "growth" have a higher degree of edges compared to other words such as "february" and "reuter". This observation demonstrates that the generated graph captures a certain level of semantic information.